Timed phylogenies with BactDating
Posted on August 16, 2019
You want to calculate the time to most recent common ancestor (tMRCA) and dates for internal splits for a given phylogeny. BactDating is an R package available at: https://github.com/xavierdidelot/BactDating
The basics
This example assumes you've removed recombination using ClonalFrameML. The output from ClonalFrameML is imported into Bactdating with the command loadCFML.
BactDating will generate a number of plots:
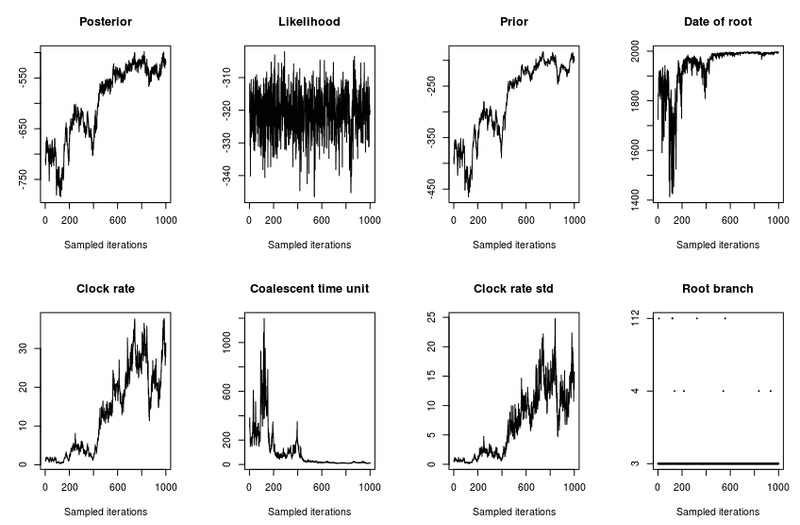
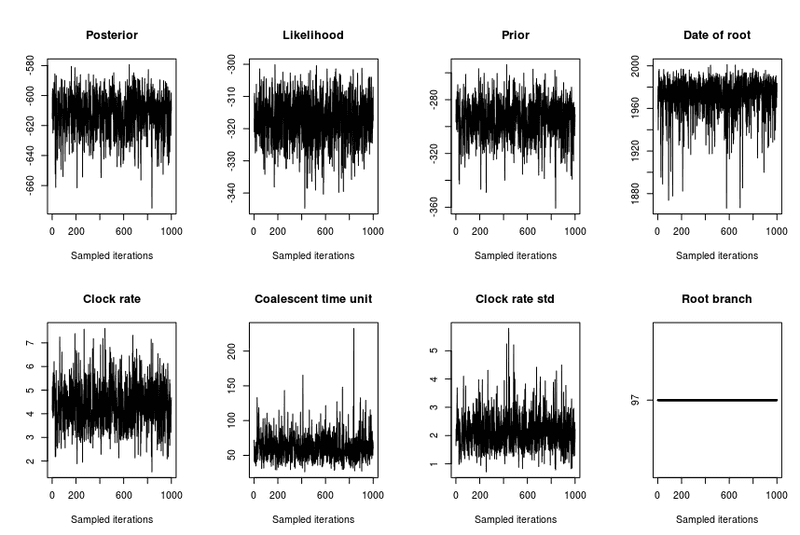
- trace: Will show the parameters for each iteration, these should look like they're converging (stabilizing). Otherwise increase number of iterations (nbIts)
- treeroot: Will plot the tree, and estimate which branch is the root.
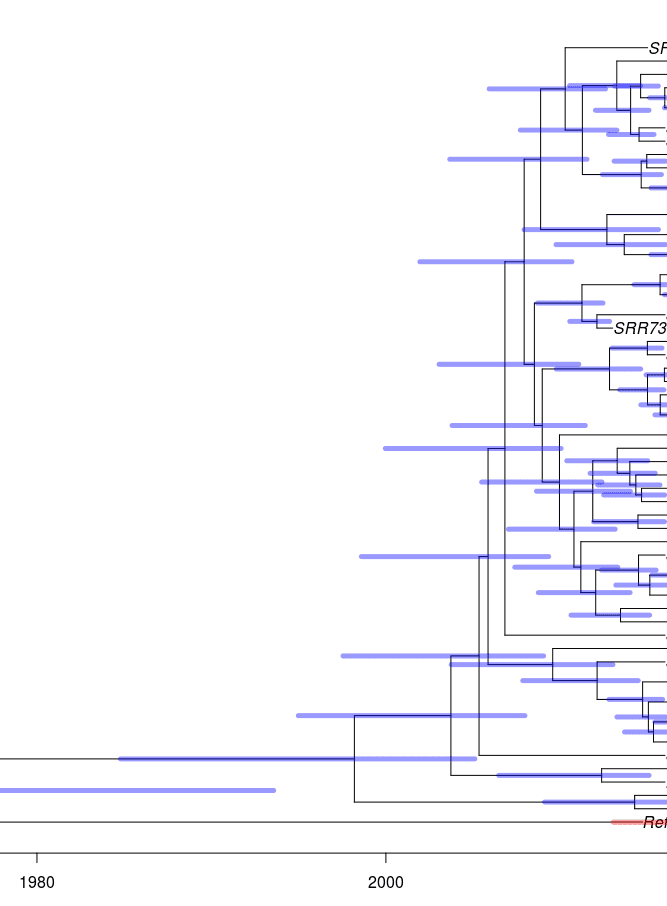
- TreeCI: Timed phylogeny with confidence intervals.
- t: Just the tree itself - no funny business.
> library(BactDating)> library(ape)> set.seed(0)> t=loadCFML('/mnt/clonal/clonal')> meta <- read.csv(file='/mnt/clonal/years', sep='\t')> res = bactdate(t, meta$Year, useRec = T, nbIts=1e5)> plot(res,'trace')> plot(res,'treeRoot',show.tip.label=F)> plot(res,'treeCI')> plot(t)
The timed phylogeny will look like this, where the blue bars indicate the 95% confidence interval:
Has it converged?
You can tell looking at the plot( res, 'trace') output. You are looking for cases where the parameters have a similar mean and variance.
NO
YES
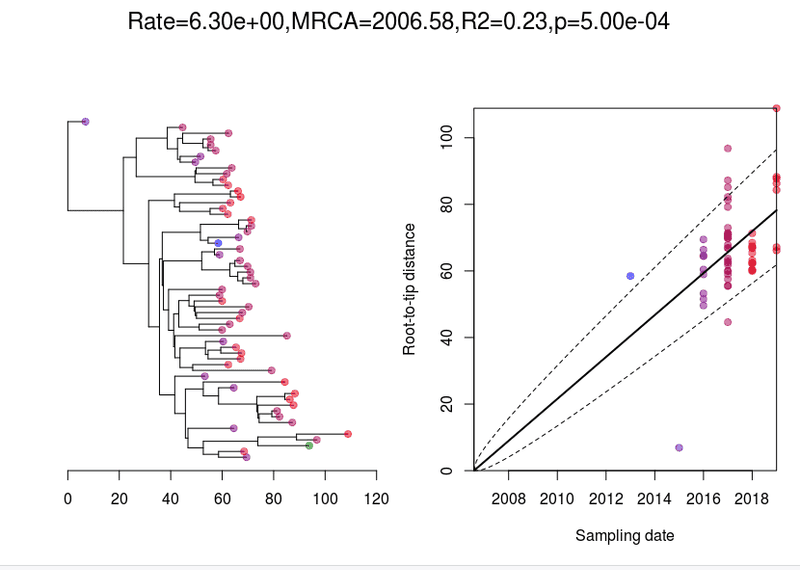
Root to tip
Plots the root to tip. This won't adjust for any recombination (unlike bactdate > res result above). You want to see an even spread of points within the dotted lines.
> root_t = initRoot(t, meta$Year)> roottotip(root_t, meta$Year)
Is the clock signal significant?
One way to test this is to repeat the analysis but give every node the same date or giving a random set of dates (the aim is to feed the program nonsense). The results generated by the real dating should be clearly better than results generated with the nonsense dating.
The sample below shows you how to set every tip to have the same date and compare the results via the Deviance information criterion (DIC). This measures the simplicity of the model and how well it fits the data. The lower the DIC the better. It is a quantitative way to see if your result with the real dates is really significant.
> res2 = bactdate(t, rep(2015, length(meta$Year)), useRec = T, nbIts=1e4)> modelcompare(res,res2)The first model has DIC=819.48 and the second model has DIC=1186.85.Model 1 is definitely better.
Because the DIC is taking into account model complexity, it is important to make sure that both the random nonsense result and the real result have actually converged.
Further tests of convergence
For further testing of convergence, you can export the BactDating result to the format required by the coda package using the command:
mcmc=as.mcmc(res)
You can then compute for example the effective sample size of the parameters using:
>effectiveSize(mcmc)mu sigma alpha13.81568 13.99970 82.08765 # BAD> effectiveSize(mcmc)mu sigma alpha501 501 501 # GOOD
The more samples the better but you should have at least 100 before you take your results seriously.
Questions or comments? @ me on Twitter @happy_khan
The banner image is an AI generated picture (Midjourney) with prompt; 'tree of life :: clockwork :: time'. You can share and adapt this image following a CC BY-SA 4.0 licence


